
With the large and growing number of cannabis users around the world, there's a definite spectrum of desired effects from the little green bush. Whilst some seek the mind-altering highest high possible, and others the gentler functional high, knowing which ratios of cannabinoids to avoid or target is valuable. This capability is primarily thanks to the wonder of our modern scientific age. Technology allows us to separate individual components from mixes containing hundreds of similar elements. This modern miracle allows us to gauge the potency of a sample by testing the THC.
However, potentially misguided as it is, the world’s ever-growing fascination with THC percentage continues. We look closer at the methods used to generate these percentages and the technology behind them.
HPLC
High-Performance Liquid Chromatography (HPLC): This is one of the most common and reliable methods for cannabinoid quantification. In HPLC, the cannabis sample is dissolved and then passed through a column, separating its compounds. Each compound (including THC) is then identified and quantified based on its retention time (how long it binds to the column) and its interaction with a detector (for example, it can be based on light absorption).
How HPLC works
HPLC is a paramount analytical technique in science, especially in analytical chemistry, biochemistry, food and drink and many more fields. One reason it is so widely used is its high value in the precise end of chemical quantification. HPLC operates under the principles of liquid chromatography, aiming to segregate, identify, and quantify individual components from complex mixtures.
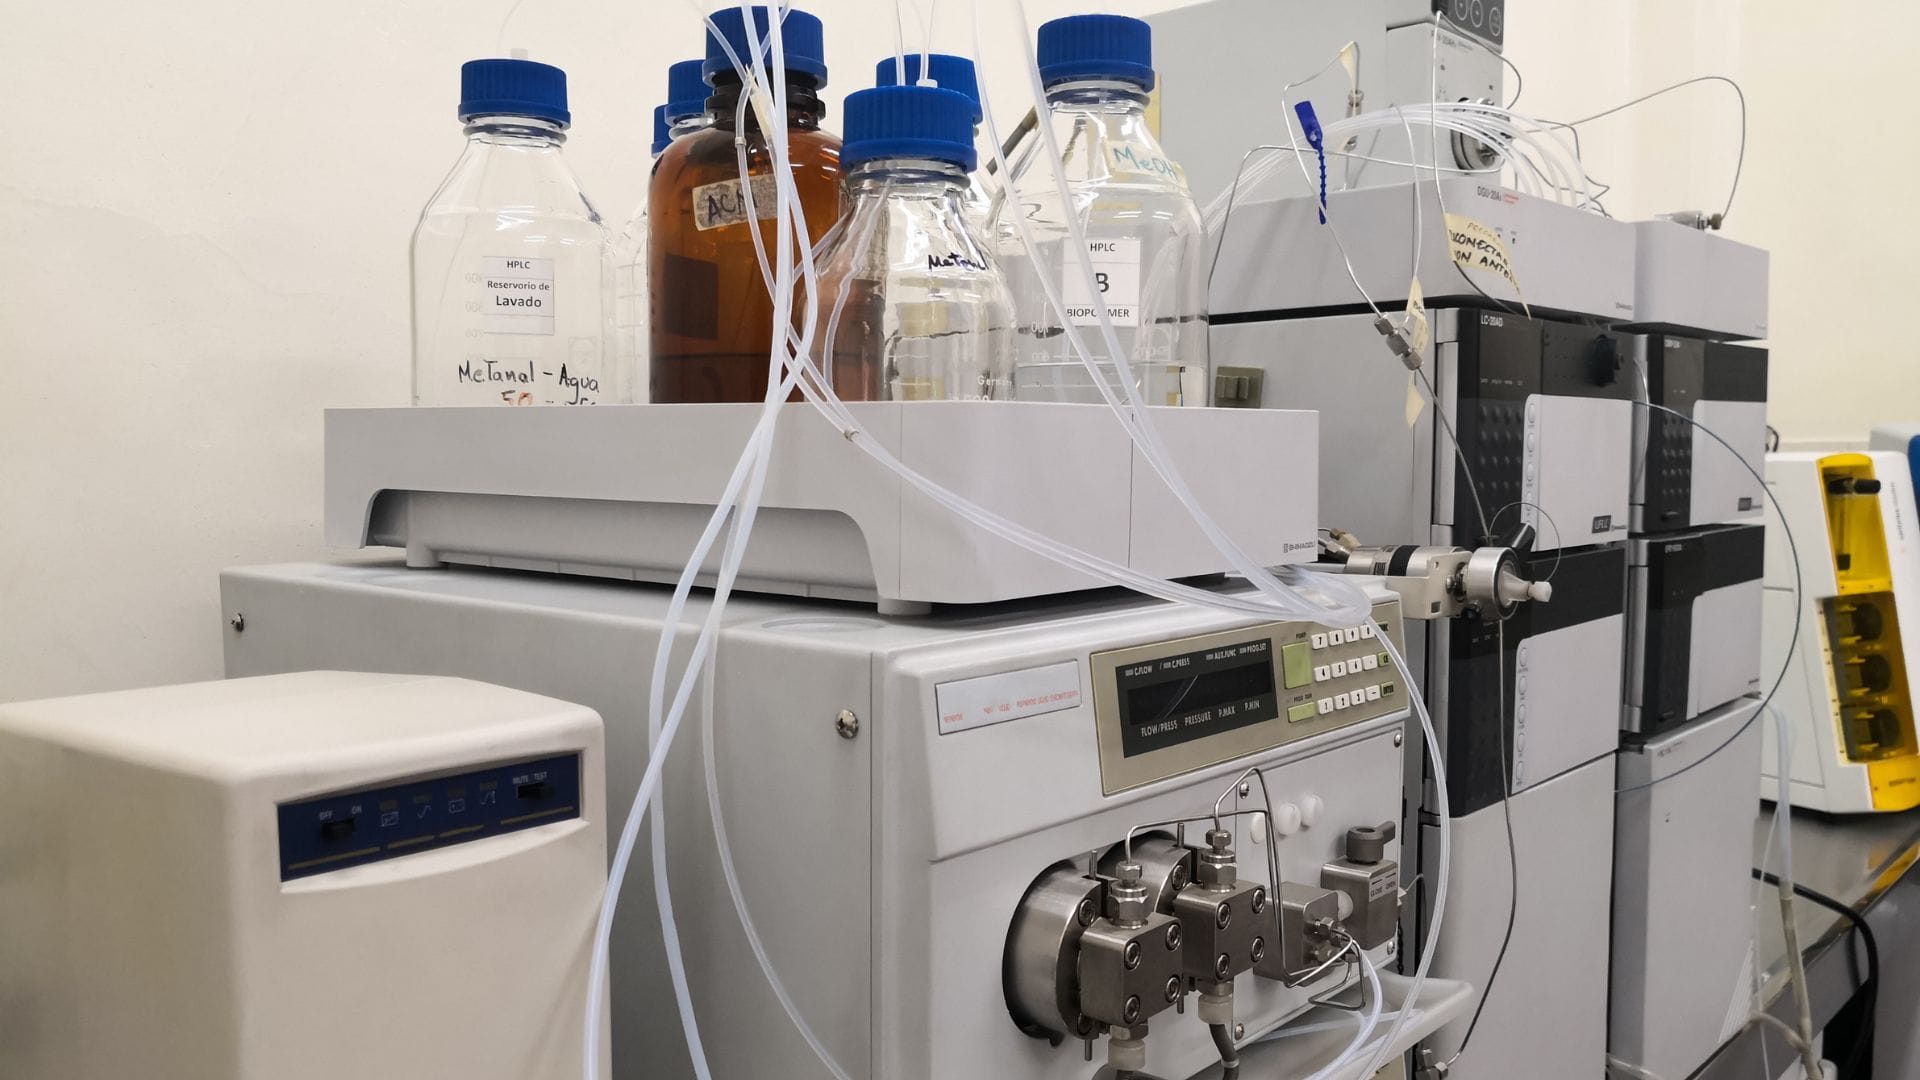
HPLC works by partitioning analytes (in this case cannabinoids) between a mobile phase (usually an organic solvent or water) and a stationary phase (a column packed with tiny particles which acts to ‘catch’ each with specific and different affinity to the column). When a dissolved cannabis sample is introduced into the HPLC system, the nuanced interactions between these analytes and the stationary phase effectuate the separation of individual compounds, including the sought-after THC.
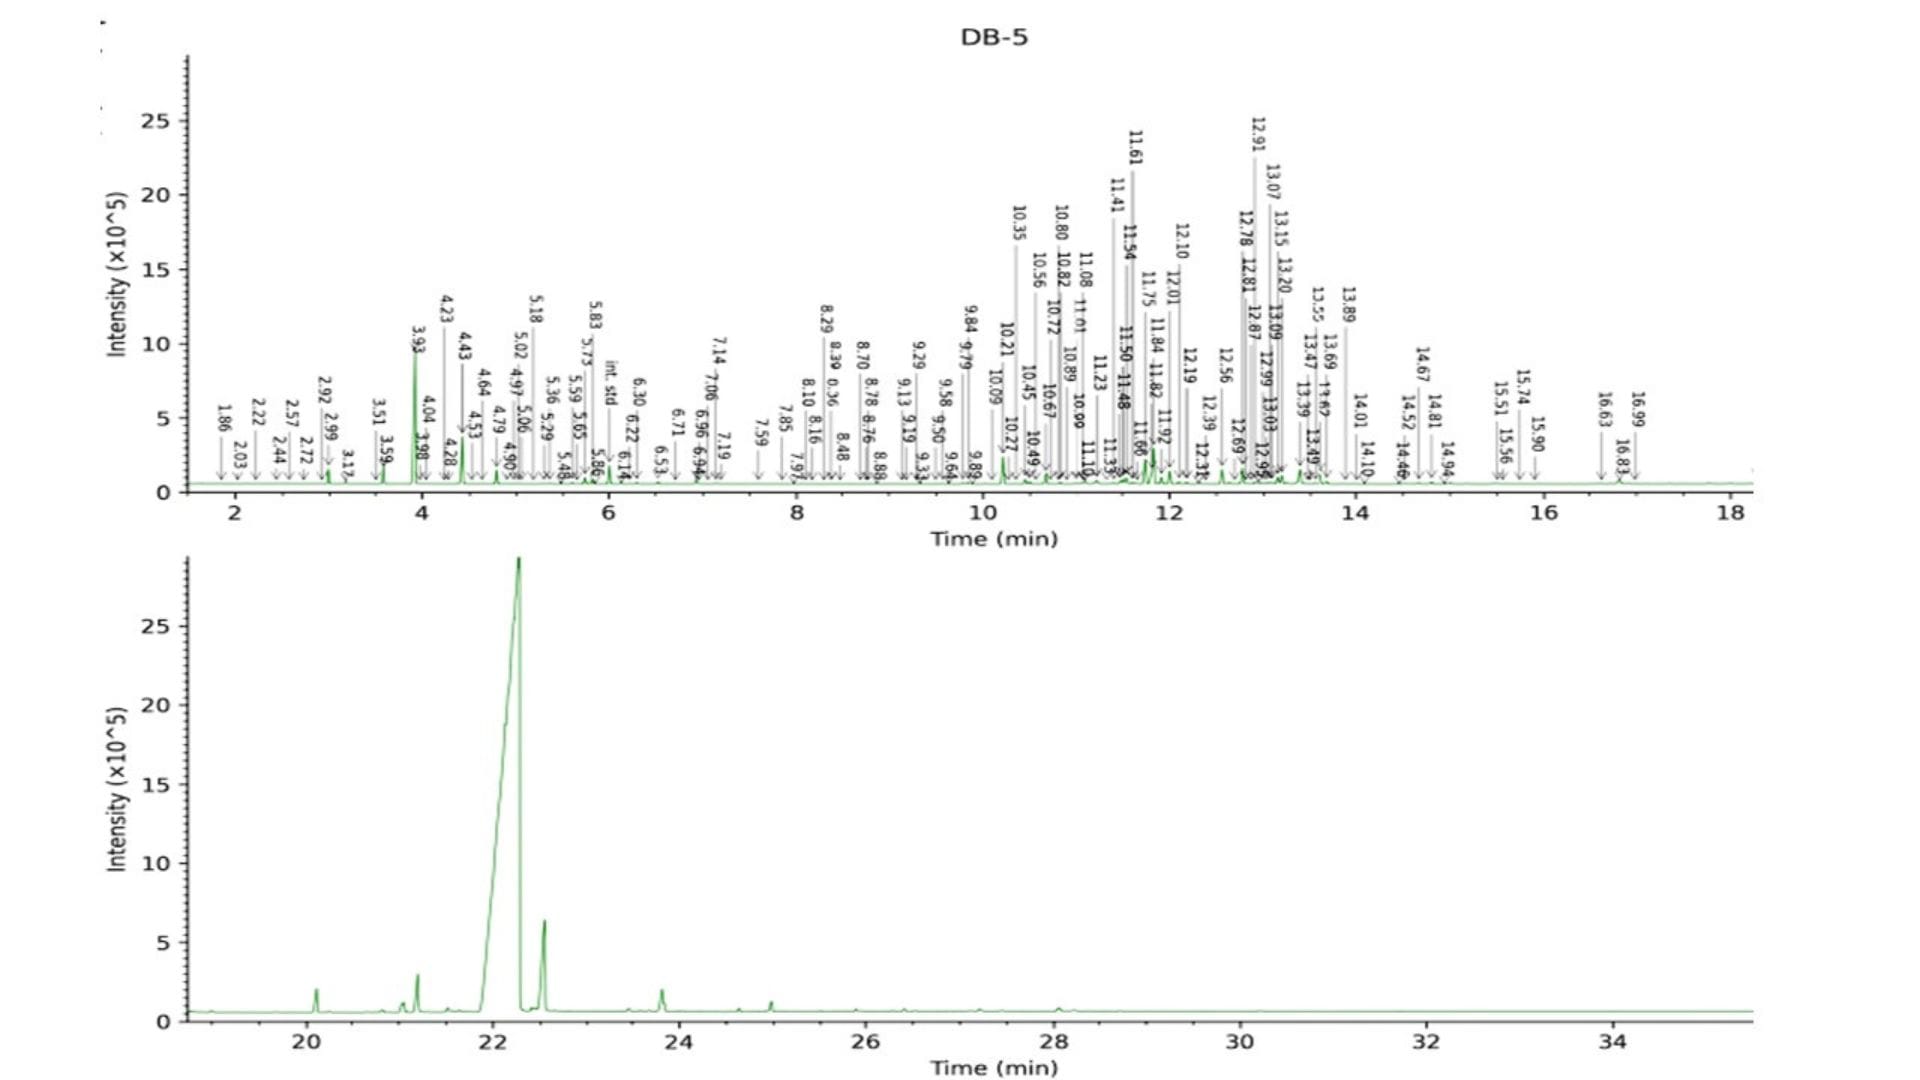
The process proceeds as follows: the dissolved cannabis sample is injected into the flow of the mobile phase. As this mixture moves through the column, different cannabinoids exhibit distinct affinities for the stationary phase, influenced by their molecular structures and the characteristics of the stationary phase itself. The differential affinities result in different travel times through the column, a phenomenon referred to as 'retention time'. It is this retention time that, when plotted on a chromatogram, manifests as peaks—each peak corresponding to a specific compound.
The Power of HPLC
THC, like other cannabinoids, has a characteristic retention time under specific chromatographic conditions, which makes its identification possible. Once the THC peak has been distinguished from other peaks on the chromatogram, its quantification is achieved by evaluating the area under the peak. Calibration curves, constructed using known concentrations of THC standards, enable the transformation of this area into a concentration, providing an accurate quantification of THC in the sample.
Moreover, the detector plays a pivotal role in this identification and quantification process. Common detectors, like UV-Vis or Diode Array Detectors (DAD), detect compounds based on their ultraviolet or visible light absorption. The intensity of the detected signal is directly proportional to the concentration of the compound passing through the detector at any given time. Given the inherent UV-absorbing properties of THC, such detectors offer heightened sensitivity and specificity for THC detection.
Here is an HPLC chromatograph, or chromatogram. Peaks representing individual compounds in a sample. Each peak's position, or retention time, indicates when the compound exits the column, while its height or area represents the compound's concentration. By analysing these peaks, researchers can identify and quantify the components of a sample.
The Pitfalls Of HPLC
Although the power of the technology’s precision is hard to rival, it does come at both a high expense and a high level of expertise. Although paying for the service done in a lab is not overly expensive, having one in-house requires a lot of capital investment. Then, you need to have it regularly calibrated with renewed standards. The time to run a sample adds to the drawbacks of this technology. Running many samples in succession requires a single run each go, making long time frames. Then add in that the sample must be destroyed to measure it, along with the fact these tools are stationary fixed benchtop units, which means this technology, although highly precise, could be doing with an injection of speed and portability.
Near-Infrared Spectroscopy (NIRS)
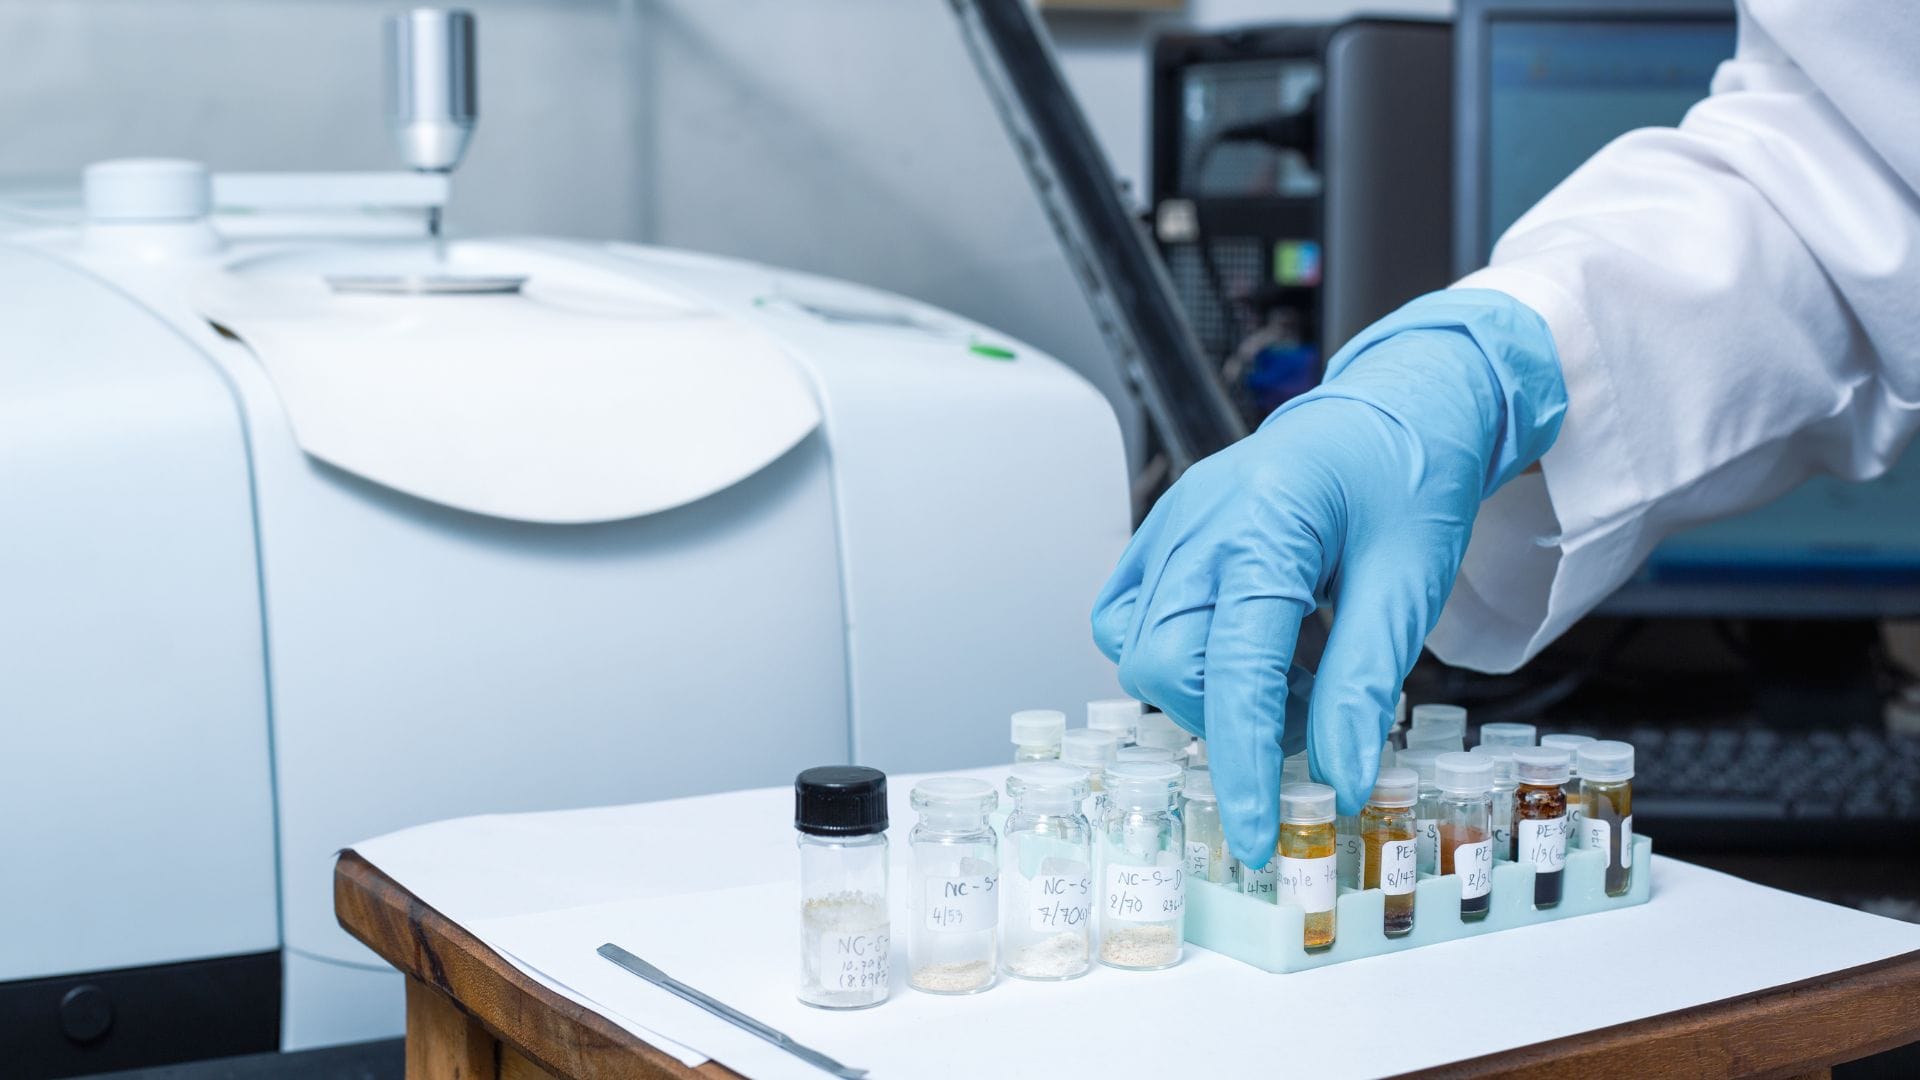
NIRS measures the absorption of near-infrared light by organic compounds. Different compounds will absorb light at different wavelengths, providing a unique spectrum. By comparing the spectrum of a sample with known references, it's possible to quantify THC and other cannabinoids. While this method is less common and may not be as accurate as chromatographic methods, it's non-destructive and rapid.
Near-infrared spectroscopy (NIRS) is a versatile analytical technique that has gained traction in various scientific domains, from food science to pharmaceuticals and, more recently, in the analysis of cannabis. At its core, NIRS gauges the absorption of near-infrared light by organic compounds, offering a peek into the chemical makeup of samples without destructive testing.
How NIRS Works
The fundamental principle underpinning NIRS is that molecules vibrate at specific frequencies, and these vibrations interact uniquely with near-infrared light. When subjected to this light, different compounds absorb it at distinct wavelengths, resulting in a characteristic spectrum. The peaks and valleys in this spectrum can be thought of as a molecular "fingerprint" of the compound.
Given the burgeoning cannabis industry's regulatory landscape, there's been an increasing demand for accurate and rapid testing methods to determine cannabinoid profiles, including the quantification of THC. NIRS presents a promising approach for this. By comparing the NIR spectrum of a cannabis sample with reference spectra from known samples, it's feasible to quantify THC and other cannabinoids. Essentially, the sample's spectrum is matched against a library of reference spectra. The better the match, the more accurate the quantification.
The Power Of NIRS
One of the standout advantages of NIRS is its non-destructive nature. Unlike other methods that require the sample to be altered or consumed, NIRS allows the same sample to be tested multiple times or used for further analysis. Speed is another advantage for NIRS. Since the technique doesn't demand extensive sample preparation, results can be generated in real time or within minutes by anyone. This is especially useful given the unit's potential for portability. Technological advances are driving the development of portable NIRS devices, some already in circulation, opening the door for on-site testing.
The Pitfalls Of NIRS
While NIRS is incredibly powerful, its accuracy may not always rival chromatographic methods, especially for complex mixtures or samples with closely related compounds. The accuracy of NIRS depends heavily on the quality of the reference spectra and the calibration of the equipment. For NIRS to be effective, there's a need for an extensive library of reference spectra. Building and maintaining this library requires meticulous effort and resources. Factors like sample moisture, particle size, and external contaminants can influence NIRS readings, potentially affecting the accuracy of results.
Other THC testing technologies:
Gas Chromatography (GC)
Gas chromatography is almost like HLPC, except the cannabis sample is vaporized, and its compounds are separated based on their vapor pressures and interaction with a column's internal coating rather than dissolved and forced through a matrix as per HPLC. However, GC uses heat, which can decarboxylate THCA (the acid form of THC) into THC, making it challenging to measure the original levels of THCA and THC separately. This applies to all the cannabinoids and their acidic cousins, thus limiting the scope of the technology.
Thin-Layer Chromatography (TLC)
TLC is a more straightforward, less expensive method involving placing a sample on a plate and watching the compounds ascend at different rates when exposed to a solvent. This method can visually represent the cannabinoids present, including THC, but is much less precise than HPLC, NIRS or GC.
Immunoassays
Immunoassays/immunoblots are quick tests often used for preliminary screening. They involve using antibodies designed to bind to THC. When THC is present in a sample, it will bind to these antibodies, producing a detectable signal. While immunoassays, like the Duquenois–Levine reagent test, are fast and relatively easy to use, they aren’t that quantifiable and might produce false positives or false negatives.
Conclusion
The next time you see a certification of analysis (COA), be sure to check the method used to generate the quantification. There are a number of ways to measure THC levels, and knowing which ones are accurate or not can be handy when determining potency. HPLC is a tried and tested method that is the most precise, although it requires expert users and is an expensive kit. NIRS is getting better and more common but still has a slightly higher error margin than HPLC. NIRS is rapid, easy for non-experts to use, and is non-destructive and portable; this and a much lower purchase price make it an important player in the space.
